Greenhouse Gas
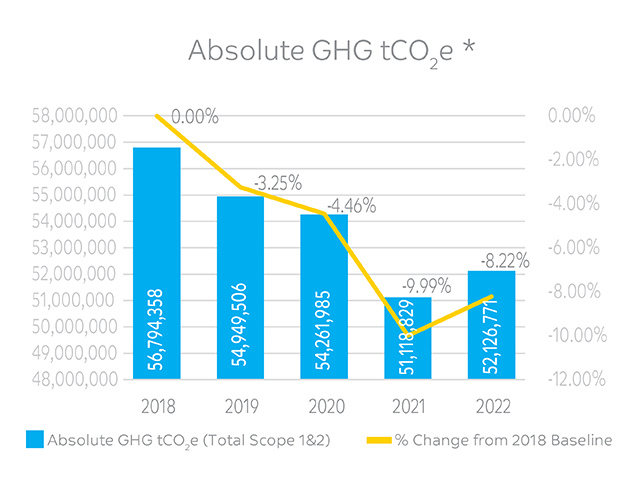
In 2022, absolute emissions increased by 2% compared to 2021, with an increase of 3.2% in Scope 1 and a decrease of 1.1% in Scope 2 emissions. The increase in Scope 1 emissions is directionally proportional to the increase in production (+3.9%) vs 2021. The main driver for the 1.1% drop in Scope 2 emissions is the continued grid emission factor updates around the world as well as the execution of key PPAs in Europe, increasing our share of dedicated renewable power and thereby directly reducing SABIC’s Scope 2 GHG emissions.
GHG EMISSIONS BY SCOPE tCO2e***
| GHG in tCO2e |
|
2021* | 2022* |
|---|---|---|---|
| Scope 1 – Financially consolidated | 29,003,145 | 30,439,107 | |
| Scope 2 – Financially consolidated | 12,555,400 | 12,513,231 | |
| Scope 1 - 3.5 affiliates** | 7,004,342 | 6,820,144 | |
| Scope 2 - 3.5 affiliates** | 2,555,942 | 2,444,289 | |
| TOTAL SCOPE 1 & 2 | 51,118,829 | 52,126,771 |
* Assured by KPMG
**3.5 affiliates include Kemya, Sharq, Yanpet, and 50% SAMAC
***All numbers for Scope 2 are based on market-based accounting
SCOPE 2 REPORTING
With increased public awareness and governmental scrutiny of climate change comes heightened expectations for the depth and quality of corporate climate-related disclosures. As we seek to progress on our Carbon Neutrality Roadmap, we understand that this journey requires transparent assessments that lead to learning and improvements. For example, our CDP Climate Score declined in 2022 (for our 2021 disclosures) to a C rating from a B in the previous year. This year, in response, we undertook an initiative to report on our Scope 2 emissions using both location and market-based accounting methods. The increased granularity is necessary to tell the whole story of SABIC’s net zero carbon strategy. We strive to bring significant renewable capacity through the use of PPAs in order to ensure long-term supply of clean power to our manufacturing sites. The grid itself is making gains in reducing the CO2 emissions associated with every MWh generated, but SABIC is doing even more, and this is positively reflected in the 2022 market-based Scope 2 emissions. With additional amounts of renewable energy being bought by SABIC, we should start to see significant differences in location-based and market-based reporting. This reporting initiative – alongside others like working to align our disclosures with TCFD recommendations by 2023 – will allow us to respond to the disclosure expectations of our stakeholders.
2022 SCOPE 2 EMISSIONS tCO2e**
| Source |
|
Location-based | Market-based | Delta |
|---|---|---|---|---|
| Electricity | 14,530,345 | 14,333,675 | ||
| Heating/Cooling | 623,845 | 623,845 | ||
| Total | 15,154,190 | 14,957,520 | 196,670 |
**3.5 affiliates include Kemya, Sharq, Yanpet, and 50% SAMAC
GREENHOUSE GAS INTENSITY
Greenhouse Gas Intensity
(tCO2 e/t Product Sales)
RENEWABLE POWER
Securing renewable energy to power operations is a priority in SABIC’s Carbon Neutrality Roadmap over the next decade. We plan to procure more than 4 GW of renewable energy through solar, wind, and hydroelectric across Saudi Arabia, Europe, the Americas, and Asia-Pacific.
From January 2023, our sites in Geleen and Bergen op Zoom in The Netherlands began taking supply of renewable wind power from the SwifterwinT windfarm. The 730 GWh renewable wind power represents yet another leap forward in our global carbon neutrality strategy, providing 90% of our annual power demand in the Netherlands and helping us to reduce our indirect CO2 emissions by over 300,000 metric tons.
SCOPE 3 REPORTING
Since 2011, SABIC has been reporting its direct emissions (Scope 1) and indirect emissions connected to outsourced energy supply (Scope 2). In 2019, we commenced our Scope 3 reporting journey, taking a comprehensive look at all 15 categories as part of our commitment to improving and supporting our value chain partners’ sustainability aspirations. In 2021, SABIC received limited assurance on Scope 3 emissions for the calendar year 2020, becoming one of the first companies in the industry to assure overall Scope 3 emissions.
In alignment with our Carbon Neutrality Roadmap, SABIC intends to reduce indirect Scope 3 emissions along the value chain. We aim to achieve this objective by opening a dialogue with major customers and suppliers to ascertain their carbon reduction plans to determine how SABIC can contribute to their sustainability journeys. SABIC is also working with its peers to improve the Scope 3 estimation process with the objective of standardizing it. In parallel, we continue to assess the GHG emissions of all non-consolidated companies in which SABIC holds an equity share greater than 20%, reported under Category 15. By working towards a comprehensive understanding of emissions beyond its operations, SABIC aims to make improvements in identifying and managing risks and opportunities in connection with value chain emissions.
In 2021, we reported two calculations for total Scope 3 emissions. When considering the 3.5 affiliates (Kemya, Sharq, Yanpet, and 50% SAMAC) as Joint Arrangements in accordance with IFRS criteria, Scope 3 emissions amounted to 107 million tCO2e in 2021. In these calculations, however, we did not include the sold products of the 3.5 affiliates; this year, we have included them, which has impacted Scope 3 Categories 10 and 12, resulting in total Scope 3 emissions increasing to 120 million tCO2e. When applying this criteria to 2021, the recalculated total Scope 3 emissions is 117 million tCO2e (instead of 107 million tCO2e). Hence, 2022’s figure represents a 3% increase when compared to 2021 under the same criteria.
When reporting the direct emissions of the 3.5 affiliates under Scope 1 and 2, Scope 3 emissions increased to 120.2 million tCO2e in 2022 from 117 million tCO2e in 2021, up by 3%. The primary driver of this increase was our new asset, the Gulf Coast Growth Ventures (GCGV) manufacturing facility in San Patricio County, Texas, a joint operation with ExxonMobil. Having been commissioned last year, 2022 marks the asset’s first full year of operation, and this increased activity affected various Scope 3 categories.
The categories contributing the most to SABIC Scope 3 emissions were: Category 10 Processing of Sold Products, Category 1 Feedstock, Category 11 Use of Sold Products, and Category 12 End-of-life treatment of sold products.
SCOPE 3 EMISSIONS SUMMARY*
| Scope 3 Emissions in Million tCO2e |
|
2021 | 2022 |
|---|---|---|---|
| Financially consolidated 3.5 affiliates** reported in Scope 3, Category 15 | 117 | 120 | |
| Total GHG Scope 3 3.5 affiliates** reported in Scope 1 & 2 | 117 | 120 |
*Assured by KPMG
**3.5 affiliates include Kemya, Sharq, Yanpet, and 50% SAMAC
OUR APPROACH TO CALCULATING SCOPE 3
In calculating Scope 3 emissions, SABIC uses primary data for Category 15 (Investments) and secondary data for all other categories. Our aim is to move to using primary data as much as possible in our Scope 3 calculations. SABIC Joint Venture Affairs, the global venture management arm of SABIC, is actively promoting carbon neutrality and encouraging SABIC’s Joint Ventures to provide their Scope 1 & 2 emissions data; this year, the number of emissions reporter rose from 12 to 14.
Our approach to accounting for Scope 3 emissions draws from two sources: WBCSD’s Corporate Value Chain (Scope 3) Accounting and Reporting Standard and SABIC’s Procedure for Scope 3 Accounting and Reporting, a version of the above standard adapted to SABIC’s needs. Several salient aspects of our Scope 3 accounting are listed below:
– We reported feedstock, a short list of strategic chemicals we purchase and use in our processes, as a separate Category 1 item, “Emissions associated with purchased goods and services: feedstock.” Calculations are based on actual purchases of feedstock and cradle-to-gate emission factors sourced from the life cycle inventory database, Ecoinvent 3.6.
– We clustered all other purchases in a combined Category 1 & Category 2, “Emissions associated with purchased goods (other than feedstock), services, and capital goods.” For these categories, we are applying economic activity-based emission factors from the Department for Environmental, Food and Rural Affairs (DEFRA).
– For Category 3, “Emissions associated with fuel and energy use not already reported in Scope 1 and 2,” we have applied upstream purchased fuels and electricity cradle-to-gate emission factors from The Engineering Toolbox and regional electricity grids.
– The approach to Category 4, “Emissions associated with upstream transportation and distribution,” is based on inbound (suppliers) and outbound (from SABIC to direct customers) transport operations. The calculations are based on metric tons carried and mileage traveled applied to transport mode emission factors from DEFRA.
– Category 10, “Emissions associated with processing of sold products,” is calculated using processing and cradle-to-gate emission factors from Ecoinvent v3.6 applied to the estimated proportion of sold products based on percentage market segment share and to the second derivative level (when the sold product is an intermediate). When internal data of the final markets are not accurate enough, we have used external market studies like IHS Markit.
– Category 11, “Emissions associated with the use phase of sold products,” is primarily comprised of sold Agri-Nutrients products associated with the release of CO2 and N2O emissions from urea-based fertilizers. Tier 1 emission factors linked to use phase emissions of fertilizers (from the Intergovernmental Panel on Climate Change) have been applied. In addition, emissions related to the combustion of products used as fuels have been included in this category.
– Category 12, “Emissions associated with the treatment of sold products at the end-of-life,” accounts for emissions related to the typical end-of-life treatments arising during recycling, incineration, and landfilling of articles made of our plastic products at the end of their service life. For simplification, average worldwide emission factors have been used in calculations (Ecoinvent 3.6 for end-of-life treatment; and World Bank Waste 2.0 Report (2018) for regional final fate share).
– Under Category 15, “Emissions of investment companies,” we have considered SABIC investments in associated and joint arrangement manufacturing companies in accordance with SABIC’s Financial Statements Report. Prioritized inputs are companies’ Scope 1 and 2 emissions, if available. Otherwise, DEFRA’s economic activitybased emission factors have been applied to the latest audited monetary income available.
More details about our approach can be found in our Technical Supplement 2022.
Furthermore, SABIC recently joined TfS, a procurement-driven initiative created by chemical companies with the goal of assessing, auditing, and improving sustainability practices within their supply chains. Joining TfS will enable SABIC to progress on its sustainability goals as well as help drive the kind of collaboration that is vital for the industry in increasing transparency on upstream value chains to support further reductions in Scope 3 GHG emissions. We anticipate that some aspects of our Scope 3 accounting and reporting may change in the coming years in order to align with a common approach with our TfS partners in the chemical sector. (Please see the “Sustainable Supply Chains” chapter of this report for further details.)
REPORTING OF AVOIDED EMISSIONS AND BIOGENIC CREDITS 2022
SABIC has been gradually replacing some volumes of conventional hydrocarbon-based feedstock with alternative feedstock since we started consuming bio-based feedstock in our cracker in Geleen, the Netherlands. As part of our 2050 Carbon Neutrality Roadmap, the replacement of feedstock continues to grow steadily, which allows us to make progress in our Category 1 Feedstock emissions.
The total number of biogenic credits due to sales of certified renewable TRUCIRCLE™ products is 46 kt, from which the Biogenic CO2 emissions (actuals) to be discounted from Category 12 (Emissions associated with End-of-Life) is 8,098 tCO2e (as it is estimated that the final fate of this proportion will be incineration). Avoided emissions by virtue of deviating plastic waste from incineration and converting it in certified circular TRUCIRCLE ™ products is 9,233 tCO2e, which are reported separately in accordance with the Corporate Value Chain (Scope 3) Accounting and Reporting Standard.
SABIC's LCA Studies, substantiating the above reported avoided emissions and biogenic credits, have undergone a rigorous ISO Critical Review process, reviewed by a panel comprising of four renowned experts in the field of the study. The study aims at conformance with ISO 14040:2006 and ISO 14044:2006, and the third party full panel critical review aims for conformance with ISO 14071.