Financial Performance
SABIC's performance reflects strong financials, innovation, and portfolio optimization, driving long-term value despite global challenges.
FINANCIAL PERFORMANCE
-
Revenue
2024: SAR 139.98 Bn.
(US$ 37.33 Bn.)2023: SAR 141.58 Bn.
(US$ 37.74 Bn.) -
EBITDA
2024: SAR 19.47 Bn.
(US$ 5.19 Bn.)2023: SAR 19.02 Bn.
(US$ 5.07 Bn.) -
EBITDA margin
2024: 13.9%
2023: 13.4%
-
Income from operations (EBIT)
2024: SAR 5.74 Bn.
(US$ 1.53 Bn.)2023: SAR 3.72 Bn.
(US$ 0.99 Bn.) -
Net income from continuing operations
(attributable to equity holders of the Parent)
2024: SAR 2.10 Bn.
(US$ 0.56 Bn.)2023: SAR 1.30 Bn.
(US$ 0.35 Bn.) -
Net income (loss)
(attributable to equity holders of the Parent)
2024: SAR 1.54 Bn.
(US$ 0.41 Bn.)2023: SAR -2.77 Bn.
(US$ -0.74 Bn.) -
Earnings per share from continuing operations
(attributable to equity holders of the Parent)
2024: SAR 0.70 Bn.
(US$ 0.19 Bn.)2023: SAR 0.43 Bn.
(US$ 0.11 Bn.) -
Net cash flow from operating activities
2024: SAR 16.36 Bn.
(US$ 4.36 Bn.)2023: SAR 24.45 Bn.
(US$ 6.52 Bn.) -
Free cash flow
2024: SAR 6.16 Bn.
(US$ 1.64 Bn.)2023: SAR 13.96 Bn.
(US$ 3.72 Bn.) -
Net debt (cash)
2024: SAR -3.01 Bn.
(US$ -0.80 Bn.)2023: SAR -8.76 Bn.
(US$ -2.34 Bn.) -
Total dividend paid to equity holders of the Parent
2024: SAR 10.10 Bn.
(US$ 2.69 Bn.)2023: SAR 11.40 Bn.
(US$ 3.04 Bn.) -
Dividend declared per share
2024: SAR 3.40
(US$ 0.91)2023: SAR 3.40
(US$ 0.91)
2024 OPERATING ENVIRONMENT
- In 2024, multiple factors impacted the global economy, including geopolitical tensions, sectoral weaknesses, and China's economic slowdown; however, China's policymakers introduced new stimulus measures to support the economy and property sector by the end of the year.
- Inflation continued to ease throughout the year as major central banks enacted multiple rate cuts. The U.S. Federal Reserve began its easing cycle with a 50 basis-point rate cut in September, followed by additional 25 basis-point cuts in November and December. Similarly, the European Central Bank and other central banks lowered rates multiple times. This moderation in Consumer Price Index (CPI) inflation slightly improved petrochemical demand.
- Feedstock prices increased in 2024 despite stable oil prices, driven by tight supply caused by widespread refinery maintenance activities. Additional supply constraints included reduced exports from Russia due to Western sanctions, along with trade route disruptions caused by Red Sea hostilities and Panama Canal delays resulting from drought. New petrochemical capacities in China also contributed to rising feedstock prices by increasing demand.
- In the second half of 2024, logistical disruptions during the U.S. hurricane season added upward pressure on prices, even as oil prices retreated. However, these increases were moderated by weaker demand in China's energy sector and petrochemical industry, which faced global overcapacity and slow demand growth. Economic deceleration in the United States and near-recession conditions in Europe also capped feedstock price increases.
- The global petrochemical market faced significant challenges in 2024, driven by persistent oversupply from ongoing capacity expansions and weaker-than-expected global demand growth, which kept prices subdued. Ethylene and propylene derivative capacity growth, dominated by China and the U.S. since 2020, continued at a strong pace during the year; however, capacity growth is expected to decelerate in the coming years as markets become saturated.
Read more about the business environment we faced in 2024 and the outlook for 2025.
SABIC's financial performance has shown notable strength, with net results from continuing operations increasing by 61% compared to FY 2023. This underscores the company's capacity for innovation and adaptability in the face of evolving market conditions. The company's financial position is solid, as evidenced by its robust balance sheet. Our efforts to optimize the portfolio's fundamentals, focusing on its core business to enhance returns and reallocating capital to higher-margin opportunities, have contributed to this success. SABIC remains committed to creating long-term value for our stakeholders through portfolio optimization and improving underperforming assets, and providing an attractive dividend to our shareholders, reflecting our commitment to delivering sustained value and stability.
Summarized Consolidated Statement of Income
| SAR in Bn. |
|
2024 | 2023 | Change % |
|---|---|---|---|---|
| Sales | 139.98 | 141.54 | -1 | |
| EBITDA | 19.47 | 19.02 | 2 | |
| Income from operations (EBIT) | 5.74 | 3.72 | 54 | |
| Income tax and Zakat | 0.14 | 0.83 | -84 | |
| Net income from continuing operations | 2.10 | 1.30 | 61 | |
| Net (loss) income from discontinued operation | -0.56 | -4.08 | -86 | |
| Net (loss) income | 1.54 | -2.77 | 155 |
| US$ in Bn. |
|
2024 | 2023 | Change % |
|---|---|---|---|---|
| Sales | 37.33 | 37.74 | -1 | |
| EBITDA | 5.19 | 5.07 | 2 | |
| Income from operations (EBIT) | 1.53 | 0.99 | 54 | |
| Income tax and Zakat | 0.04 | 0.22 | -84 | |
| Net income from continuing operations | 0.56 | 0.35 | 61 | |
| Net (loss) income from discontinued operation | -0.15 | 0.35 | 61 | |
| Net (loss) income | 0.41 | -0.74 | 155 |
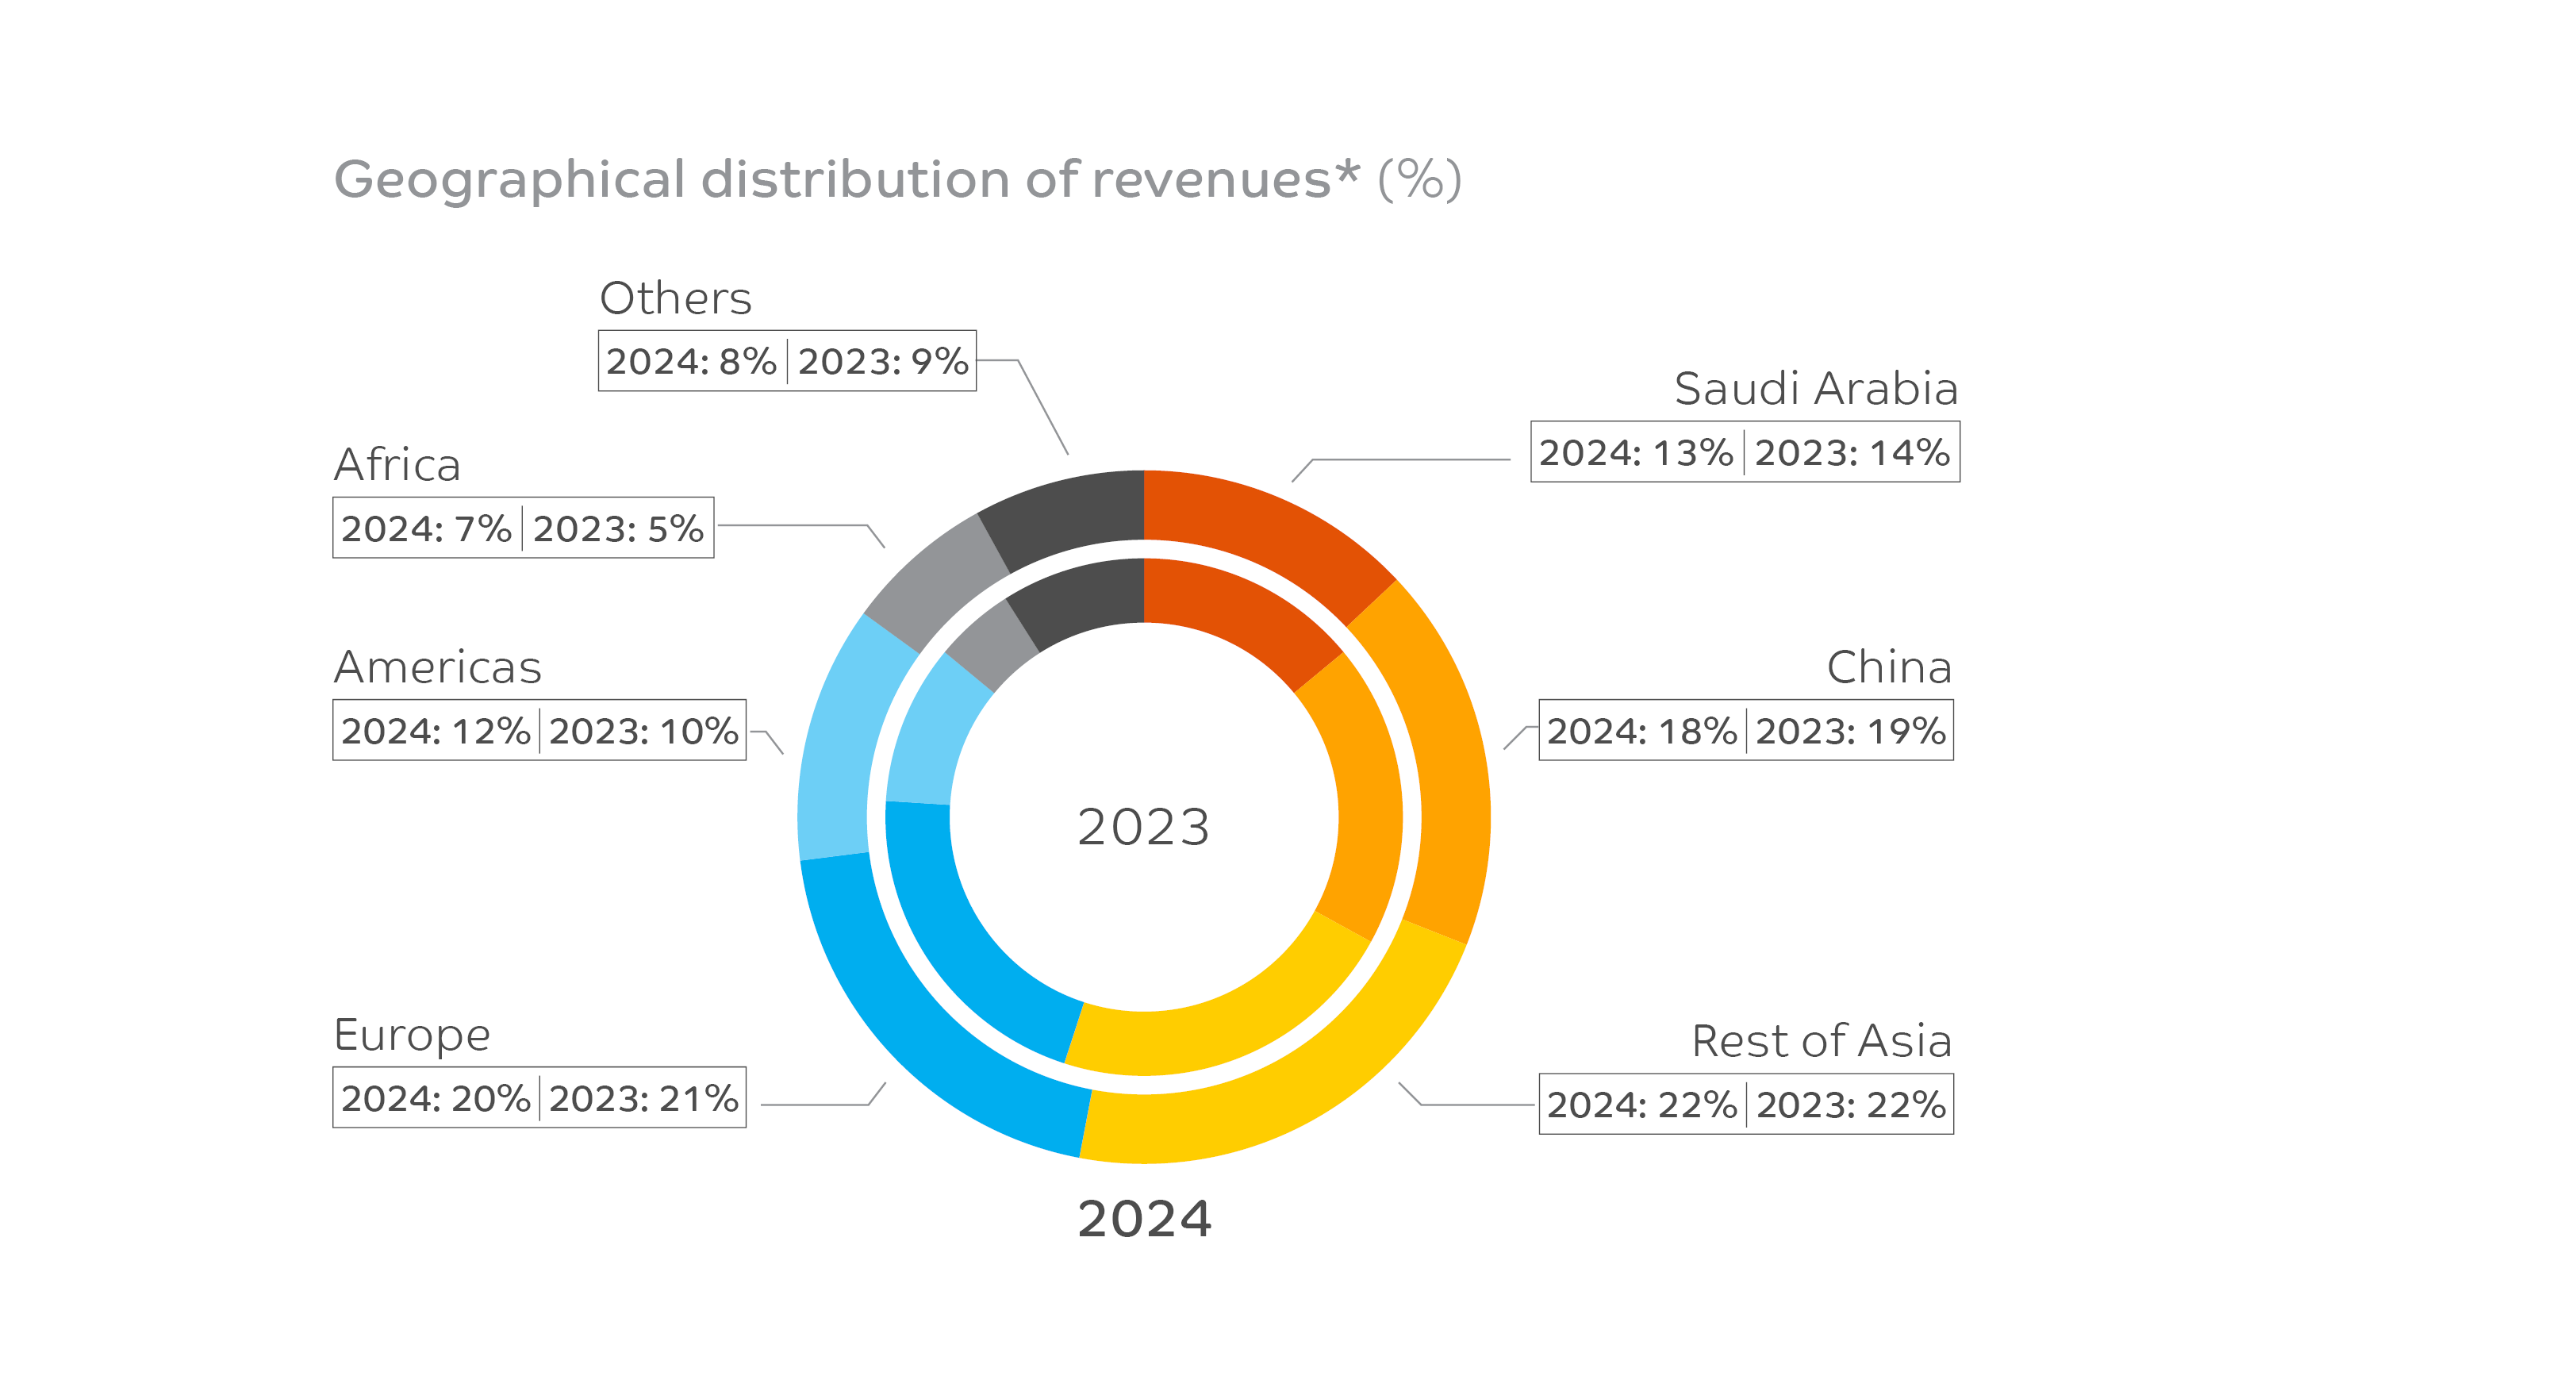
*The revenue information above is based on the locations of the customers.
A decrease in sales in 2024 compared to 2023 were primarily due to a 2% lower sales volume.
Income from operations (EBIT) was SAR 5.74 Bn. compared to SAR 3.72 Bn. in 2023, an increase of SAR 2.02 Bn. or 54%, largely impacted by higher gross profit resulting from improved margins. Specifically, a combination of a slight increase in average sales price and internal efforts to optimize variable costs has allowed the company to effectively absorb the impact of feedstock price increases. The increased gross margin was partially offset by higher operational costs.
Income tax and Zakat expenses amounted to SAR 0.14 Bn. compared to SAR 0.83 Bn. in 2023, a decrease of SAR 0.69 Bn., mostly due to the reversal of Zakat provisions in 2024 following the revision of relevant Zakat regulations.
Net losses from discontinued operations were SAR 0.56 Bn. compared to SAR 4.08 Bn. in 2023. The decrease was primarily driven by the effects of the fair value assessment of Hadeed and its operational losses recorded in the prior year, compared to a loss of SAR 557 Mn. recorded under discontinued operations in 2024.
In 2024, net income attributable to equity holders of the Parent was SAR 1.54 Bn., compared to a net loss of SAR 2.77 Bn. in 2023, an improvement of SAR 4.31 Bn. This was primarily driven by lower losses from discontinued operations and improved operational profit, partially offset by lower fair value gains from embedded derivatives in joint venture agreements.
SUMMARIZED CONSOLIDATED STATEMENT OF FINANCIAL POSITION
| SAR in Bn. |
|
2024 | 2023 | Change % |
|---|---|---|---|---|
| Total assets | 278.02 | 294.38 | -6 | |
| Total liabilities | 94.10 | 99.10 | -5 | |
| Total equity | 183.92 | 195.28 | -6 | |
| Non-controlling interests | 27.09 | 27.85 | -3 | |
| Equity attributable to equity holders of the Parent | 156.83 | 167.43 | -6 |
| US$ in Bn. |
|
2024 | 2023 | Change % |
|---|---|---|---|---|
| Total assets | 74.14 | 78.50 | -6 | |
| Total liabilities | 25.09 | 26.43 | -5 | |
| Total equity | 49.04 | 52.08 | -6 | |
| Non-controlling interests | 7.22 | 7.43 | -3 | |
| Equity attributable to equity holders of the Parent | 41.82 | 44.65 | -6 |
Total assets at year-end 2024 stood at SAR 278.02 Bn. as of December 31, 2024, a reduction of SAR 16.36 Bn. (6%) compared to the previous year (SAR 294.38 Bn. as of December 31, 2023). The decrease was mainly due to the sale of Hadeed and its subsequent removal from assets held for sale. Additionally, a net reduction of 2% in property, plant, and equipment resulted from regular depreciation and amortization.
Total liabilities at year-end 2024 amounted to SAR 94.10 Bn., down SAR 5.00 Bn. (5%) from SAR 99.10 Bn. as of December 31, 2023. This decline was primarily driven by the release of Hadeed liabilities from liabilities held for sale, reducing total liabilities by SAR 5.70 Bn. At the same time, an increase in total debt and other liabilities was offset by the release of Zakat provisions.
Equity attributable to equity holders of the Parent totaled SAR 156.83 Bn. at year-end 2024, compared to SAR 167.43 Bn. in 2023, a decrease of SAR 10.60 Bn. (6%). This decline was mainly due to declared dividends of SAR 10.20 Bn.
SUMMARIZED CONSOLIDATED CASH FLOWS
| SAR in Bn. |
|
2024 | 2023 | Change % |
|---|---|---|---|---|
| Net cash generated from operating activities | 16.36 | 24.45 | -33 | |
| Net cash used in investing activities | -7.99 | -11.76 | -32 | |
| Net cash used in financing activities | -11.56 | -18.90 | -39 | |
| (Decrease) increase in cash and cash equivalent | -3.18 | -6.22 | -49 | |
| Cash and cash equivalent at the end of the year | 30.54 | 33.80 | -10 | |
| Capital expenditures | 10.20 | 10.49 | -3 | |
| Free cash flow | 6.16 | 13.96 | -56 |
| US$ in Bn. |
|
2024 | 2023 | Change % |
|---|---|---|---|---|
| Net cash generated from operating activities | 4.36 | 6.52 | -33 | |
| Net cash used in investing activities | -2.13 | -3.14 | -32 | |
| Net cash used in financing activities | -3.08 | -5.04 | -39 | |
| (Decrease) increase in cash and cash equivalent | -0.85 | -1.66 | -49 | |
| Cash and cash equivalent at the end of the year | 8.14 | 9.01 | -10 | |
| Capital expenditures | 2.723 | 2.80 | -3 | |
| Free cash flow | 1.64 | 3.72 | -56 |
Net cash generated from operating activities in 2024 was SAR 16.36 Bn. compared to SAR 24.45 Bn. in 2023, a decrease of SAR 8.09 Bn. or 33%, mainly the result of a reduction in working capital in 2023, mostly due to inventory management efforts.
Net cash used in investing activities in 2024 was SAR -7.99 Bn. compared to SAR -11.76 Bn. in 2023, a decrease of SAR 3.78 Bn. or 32%, driven primarily by higher short-term financial investment, while capital expenditures broadly remained at the same level year over year.
Net cash used in financing activities in 2024 was SAR -11.56 Bn. compared to SAR -18.90 Bn. in 2023, a decrease of SAR 7.35 Bn. or 39%, primarily reflecting lower dividend payments to non-controlling interests as well as withdrawals from Saudi Aramco credit facilities.
FINANCING
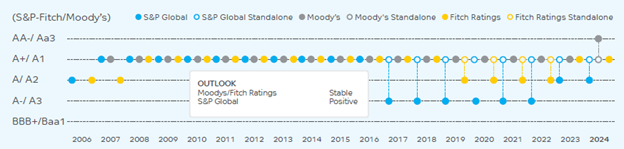
Our Financing Policy aims to ensure sufficient liquidity at all times while optimizing returns to shareholders. We use leverage prudently to fund our global growth ambitions. Our standalone credit ratings have consistently remained in the A+/ A1 band, among the highest-rated global chemical companies, demonstrating resilience over the last decade relative to peers.
Read a detailed review of our financial performance for 2024 and access our audited financial statements .
OUR APPROACH TO TAX
SABIC's approach to tax is to ensure robust tax governance across the group, alignment with SABIC's overall business objectives, and transparency and compliance with local tax authorities. In all our activities, we are committed to achieving the highest standards in corporate governance and business conduct. Our tax responsibilities are managed in line with this commitment, and we take pride in being regarded as a good corporate citizen.
Read more about our approach to tax .
Disclaimer: This abridged interactive version of the SABIC Integrated Annual Report 2024 is based on the original PDF report published on this website. In case of any discrepancy, the original PDF report will prevail.