SABIC on the Capital Markets
SABIC's stock was one of the most traded on the Saudi Exchange in 2024 in terms of value and accounted for 13% of the weight within the materials sector.
SABIC OWNERSHIP STRUCTURE
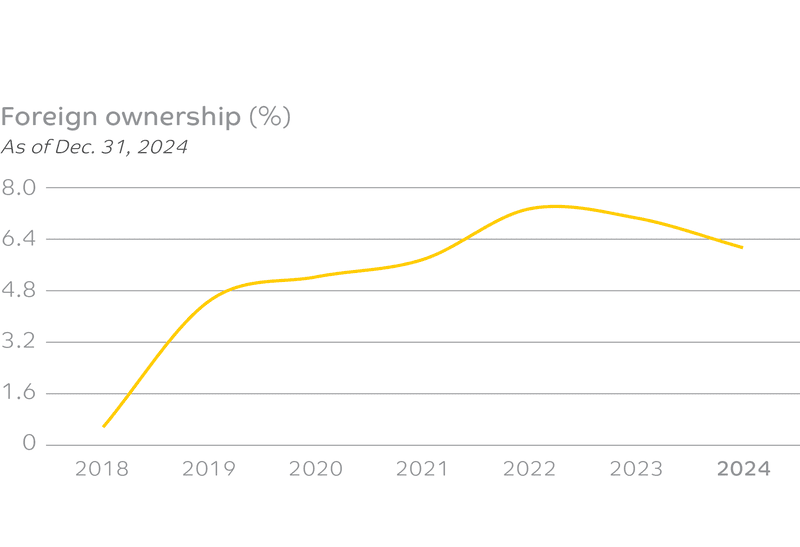
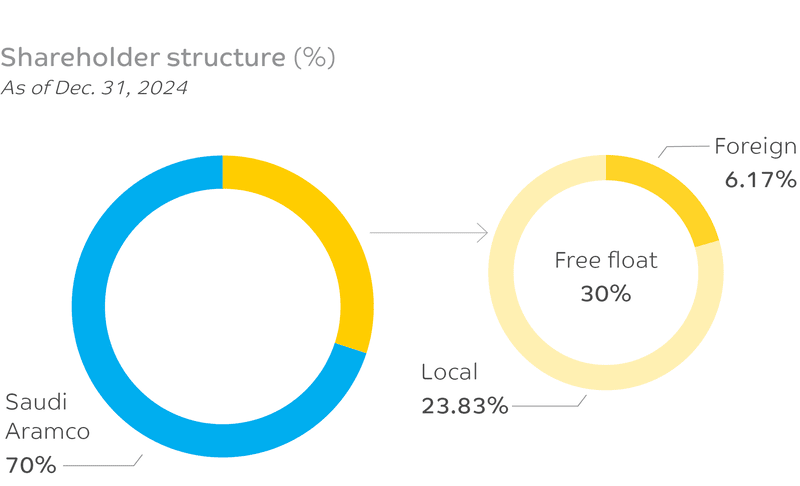
At the end of 2024, 70% of SABIC's shares were held by Aramco Chemicals Company, a wholly owned subsidiary of Saudi Aramco, with the remaining 30% in free float. Our foreign investor base expanded from under 1% in 2018 to 6.17% by the end of 2024, now comprising nearly 20.5% of our free float. This illustrates how our international investment grew significantly alongside greater global investor interest in Saudi Arabia following the country's reclassification as an emerging market in 2018.
Some shares are held by SABIC's Board members and senior executives. Apart from Aramco Chemical Company, SABIC is not aware of any shareholder with direct or indirect control over the company. Additionally, no other individuals or entities, aside from the Board, senior executives, and their relatives, have reported changes to their shareholdings during 2024.
SABIC SHARE PERFORMANCE
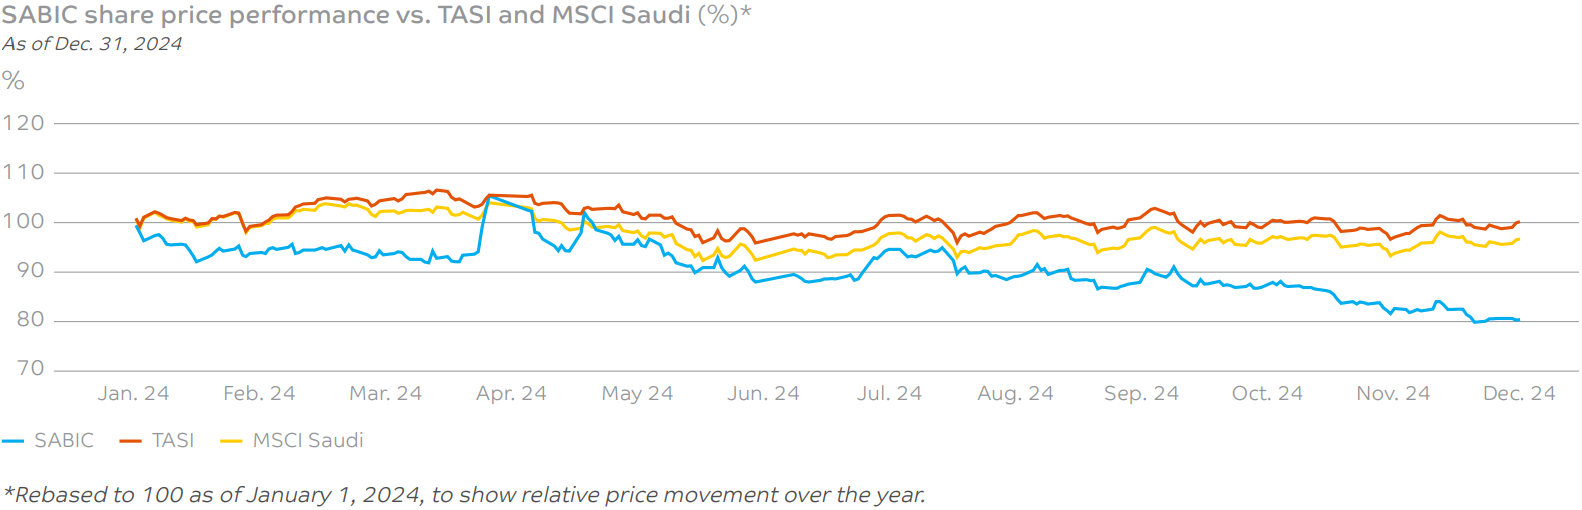
SABIC's share price opened the year at 83.6, peaked at 89.00 on April 4, and traded broadly in line with TASI until early June. The stock hit its lowest point of 66.50 on December 19, reflecting bearish petrochemicals market sentiment, and closed the year at 67. Over the year, SABIC's share price declined by 19.9%.
In 2024, 14 analysts covered SABIC, with 7 recommending buying the stock, 6 recommending holding, and 1 recommending selling.
Over the last 10 years, SABIC's Total Shareholder Return was 34.2% despite the inherent cyclicality of the chemicals industry.
SABIC was one of the most actively traded stocks on the Saudi Exchange in 2024, with a traded value of SAR 32.8 Bn. (US$ 8.7 Bn.), and accounted for 13% of the weight within the materials sector.
| Other share information |
|
2024 | 2023 |
|---|---|---|---|
| Number of registered shares issued (million) | 3,000 | 3,000 | |
| Number of registered shares eligible for dividend (million) | 3,000 | 3,000 | |
| Share price at year-end (SAR) | 67 | 83.5 | |
| Highest of the year (SAR) | 89 | 97.4 | |
| Lowest of the year (SAR) | 66.5 | 75.3 | |
| Annualized volatility | 22.5 | 22.1 | |
| Market capitalization at year-end (SAR Mn.) | 201,000 | 250,500 | |
| Market capitalization at year-end (US$ Mn.) | 53,600 | 66,800 | |
| Dividend declared per share (SAR) | 3.4 | 3.4 |
SABIC SHARE DIVIDEND AND CAPITAL ALLOCATION
At SABIC, distributing stable-to-growing, competitive dividends to shareholders over the long term remains a key priority.
Under our new mechanism for interim dividend distribution, interim dividends for the first half of the year will be announced following the approval of interim financial results for the second quarter of that same year. Similarly, the interim dividend distribution for the second half of the year will be announced after the annual financial results for the same year are finalized. This approach aligns with global best practices, reduces the time between announcement and distribution, and enables the Board to make dividend decisions based on financial statements reflecting company performance over the reporting period.
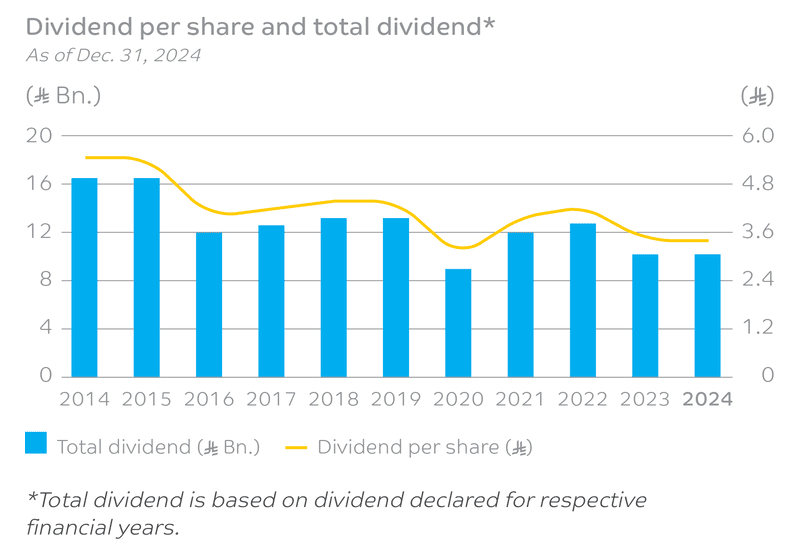
Dividend distribution details for 2024
| Dividend cycle |
|
Dividend per share (SAR) | Percentage of distribution to share nominal value | Number of shares | Date of eligibility | Total distributed dividends (SAR) | Distribution date |
|---|---|---|---|---|---|---|---|
| H2 2023 | 1.6 | 16 | 3,000,000,000 | February 12, 2024 | 4,800,000,000 | March 4, 2024 | |
| H1 2024 | 1.7 | 17 | 3,000,000,000 | September 3, 2024 | 5,100,000,000 | September 24, 2024 | |
| H2 2024 | 1.7 | 17 | 3,000,000,000 | February 11, 2025 | 5,100,000,000 | March 4, 2025 |
Read more about our capital market performance and investor engagement.
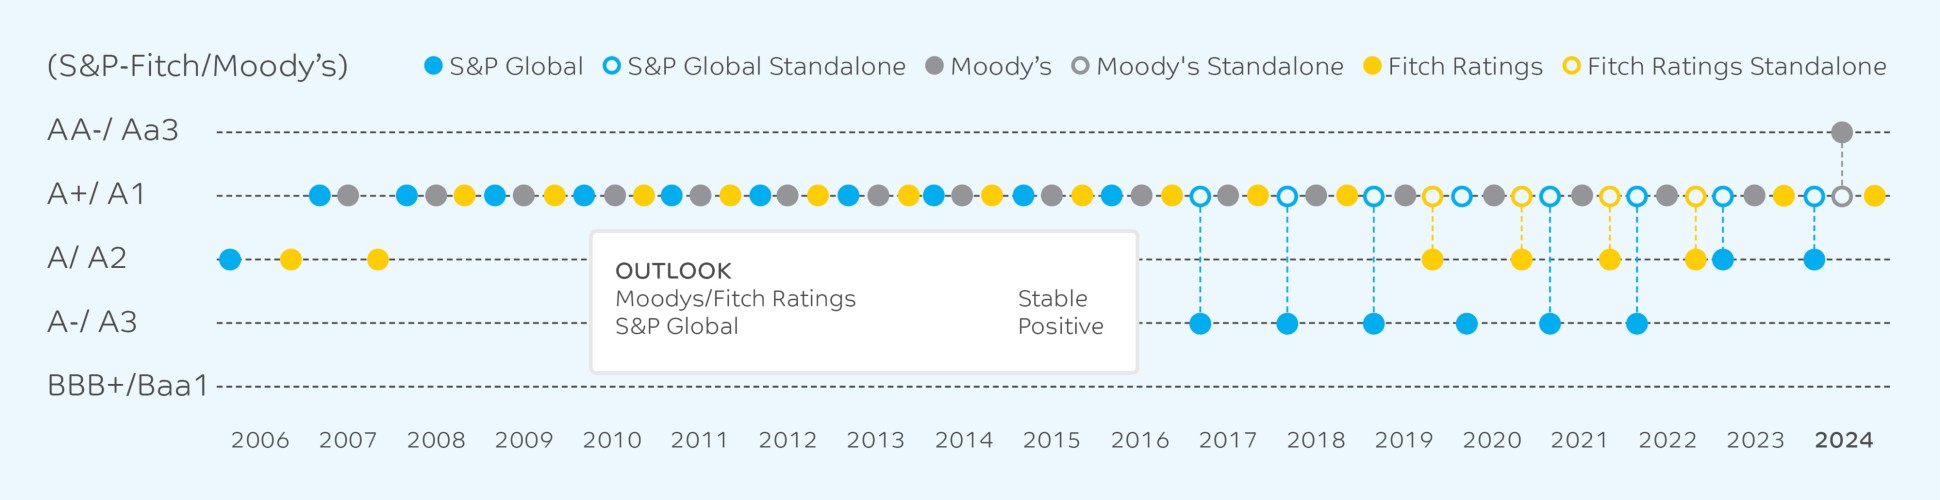
SABIC CREDIT RATINGS
Standalone credit ratings have consistently remained in the A+/A1 band, positioning us among the highest-rated global chemical companies. In 2024, our long-term credit rating was upgraded to Aa3 by Moody's following the upgrade of Saudi Arabia's sovereign rating, reflecting our resilience and strong financial position.
Disclaimer: This abridged interactive version of the SABIC Integrated Annual Report 2024 is based on the original PDF report published on this website. In case of any discrepancy, the original PDF report will prevail.