PERFORMANCE AND FINANCIAL HIGHLIGHTS
OUR PERFORMANCE SNAPSHOT IN 2024
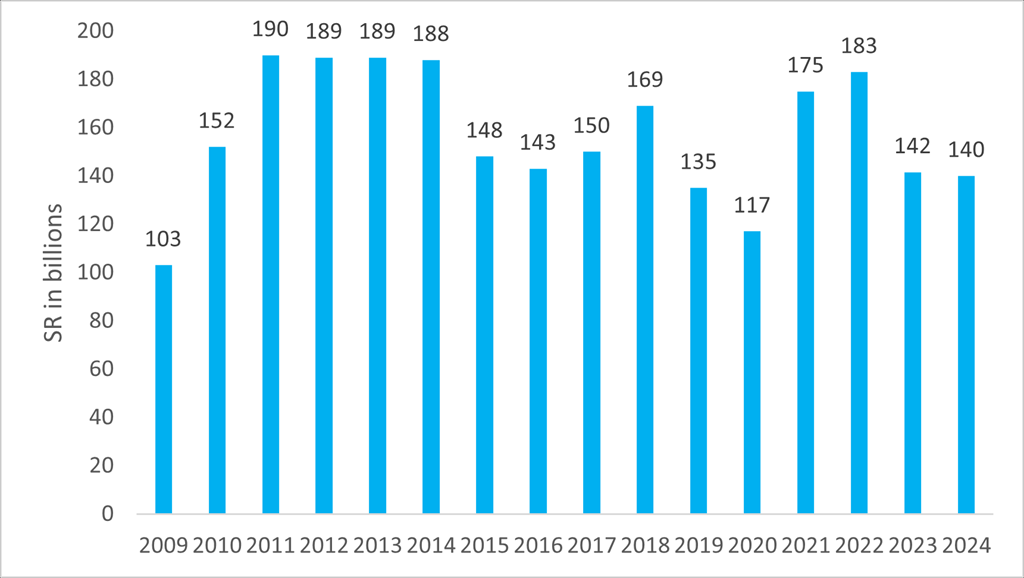
Annual revenue: SR 139.98 billion
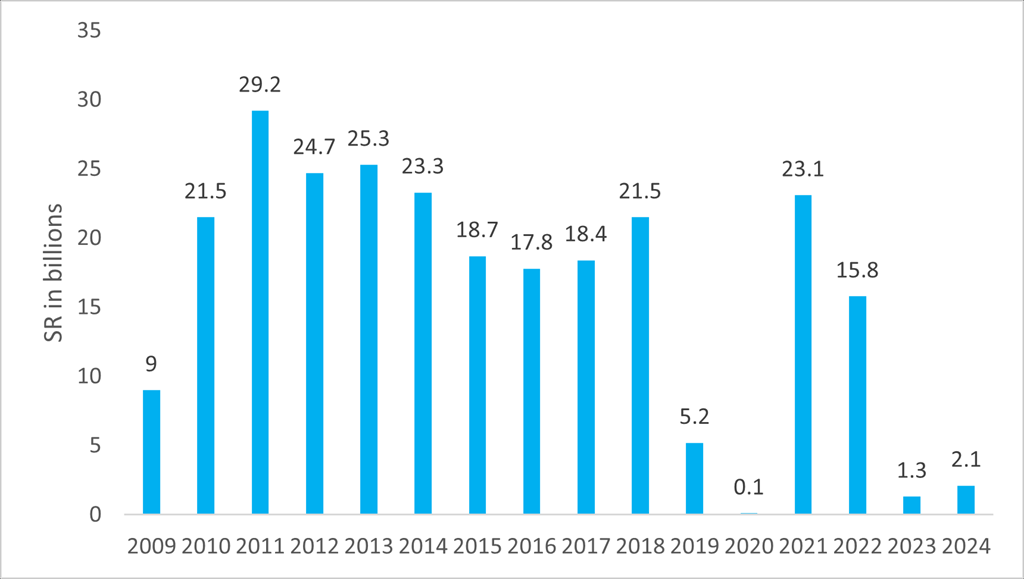
Net income (SABIC share): SR 1.54 billion
Production: 53.9 MMT
SABIC’s Adjusted Earnings:
In order to facilitate a more accurate understanding of its underlying operational performance, with the earnings release or Q2 2025 SABIC will introduce a set of adjusted financial metrics. The adjusted EBITDA, EBIT and Net Income exclude one-off special items not directly related to the regular course of business in a particular reporting period, such as major impairments, restructuring expenses, or accounting effects from fair valuation or extraordinary gains or losses from tax, disposals etc. The trajectory of such earnings before such special items will provide a more transparent and better comparable reflection of the SABIC business over time.
For SABIC’s historical quarterly adjusted earnings metrics click here.
RATIOS
| 2024 | 2023 | 2022 | |
|---|---|---|---|
| EBIT margin | 4% | 3% | 13% |
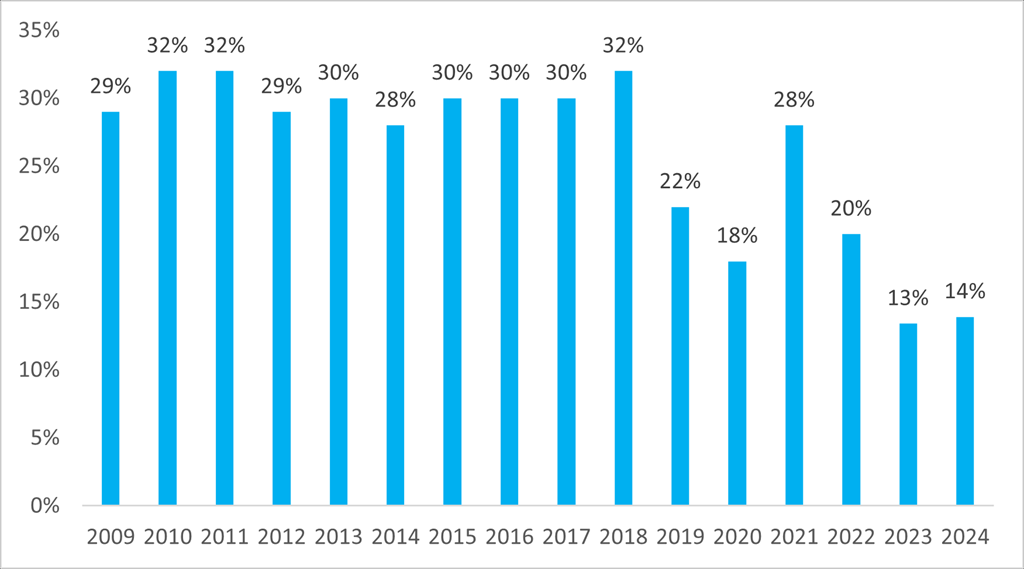
| EBITDA margin | 14% | 14% | 20% |
| Net Debt to EBITDA* | -0.2 | 0.5 | 0.4 |
| Total Liabilities/Total Assets | 34% | 34% | 30% |
| Total Debt/Equity | 19% | 14% | 13% |
| Book value per share (SR) | 52 | 56 | 62 |
| Current ratio | 2 | 2 | 2 |
| Trade receivables in days | 53 | 50 | 48 |
| Product inventory in days | 60 | 56 | 73 |
| * including short-term investments with maturities > 3 months | |||
| REVENUES | EBITDA |
 |
 |
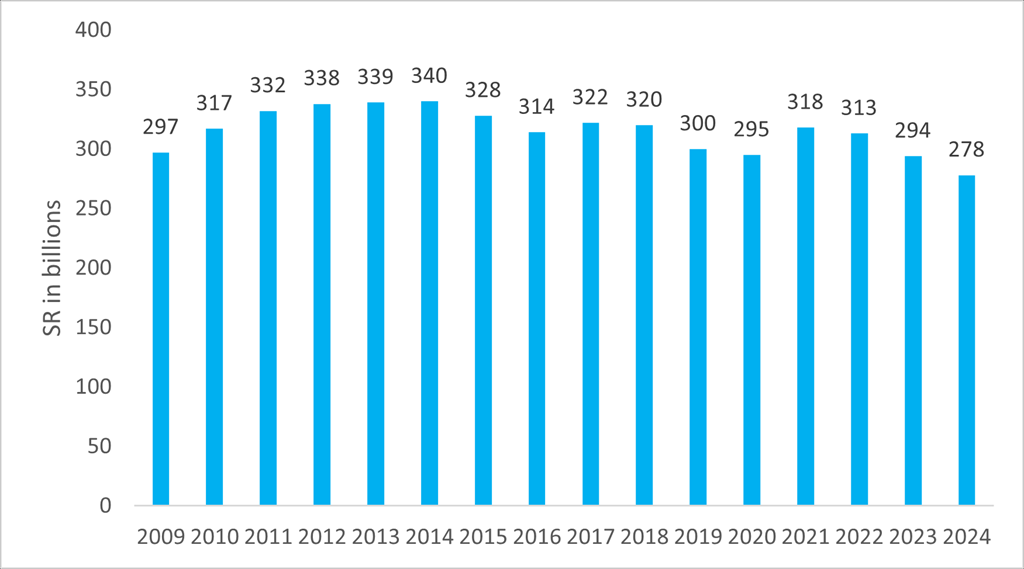
| NET INCOME | TOTAL ASSETS |
 |
 |
| * the presented net income for 2022, 2023 and 2024 is based on Net Income from continuing operation | |
